This section shows you how to create the project diagrams
- Create Project Diagrams
- Incorporating Professional Design
- Diagramming By Hand
- Diagramming with CAD
- Diagram Organization
- What Diagrams Show
- Creating Rough Background Sketches
- Take Measurements
- Creating Background Diagram(s) and Diagramming Layers
- Create Presentation Diagrams
- Wrapping Up the Diagrams
Create the Project Diagrams
Project Diagrams are the second major part of the project plan, and provide the best way to express visually what you want to have done. The project size and diagramming scale determines the size and number of diagrams necessary. Working on this part of the project plan next helps determine the material quantities needed for Planning – The Project Budget.
Project diagrams are similar to construction blueprints in that they visually show the contractor(s) the work described in the project scope of work and become an integral part of the construction contract. Project diagrams also have the added benefit of helping the designer flush out items forgotten in the planning process. The diagrams provide dimensions of the spaces and affected surface. Diagrams help contractors understand the project details as they relate to the quantities and location of specified materials.
If a project has only one or two single trades in a relatively small area, it may not be necessary to create project diagrams. However, if the project has multiple trades with overlapping or interfacing work, then it is a good idea to create some simple demolition and construction diagrams, described within this section, to help ensure that contractor(s) clearly understand the project scope.
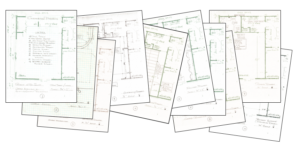
Figure 4. Sample Diagram Set
Create diagrams using computer aided design (CAD) or by hand with pencil and paper, the more traditional and arguably easier method.
Incorporating Professional Design
If you plan to have a professional designer create your construction drawings, look on www.AIA.org, for a licensed designer in your area.
If you already have a designer, continue reading to better understand what your designer should be doing and providing you.
You’ll need to make sure your designer’s drawings are completely coordinated with your entire project plan. The best way to do so is to have your designer create your background drawings, as discussed in Planning – Creating Background Diagram(s) and Diagramming Layers.
Use the designer’s background drawings/diagrams to help you calculate material quantities and costs as discussed in Planning – Assemble the Project Budget.
A good designer can help you through all the steps of planning your project, but whether they do or not, you must understand the planning process in order to control your project.
As discussed in the Construction Overview, finding and solving design problems before signing a contract saves a lot of time and money, eliminating headaches during the construction phase. Having the design documents peer reviewed by a qualified, objective and reputable professional helps make sure design documents are as free of errors and omissions, as possible.
Diagramming by Hand
You can choose to use a CAD application (we’ll talk about that next), and you can also successfully create all of the project diagrams using simple hand-drafting methods, eliminating the need for complicated and/or costly computer software.
I am guessing that you might be thinking that you don’t know how to draw.
Well guess what… You don’t need to know how to draw in an artistic sense, to draft your project diagrams. If you can:
- Use a ruler
- Use a pencil
- Follow a straight line
- Trace the outline of a shape
Most everyone has the skills needed to create project diagrams. All you need is a little knowledge and understanding about what to do and how to create them.
Just remember that these diagrams have a singular purpose, to visually describe the project in coordination with the written Scope of Work. Diagrams are essentially line drawings in a flat, vertical or horizontal plane. These drawings do not need to be pretty, three-dimensional renderings. Besides, going through the expense of creating digitally rendered or professionally illustrated images will not help the project turn out any better.
When drafting the diagrams by hand, work in pencil. The drafting process tends to require many corrections and erasing, and redrawing is easier and faster than starting over. The best drafting pencil is a mechanical pencil with a 0.7 mm graphite tip, because it is always sharp, creates an easily visible line and is sturdy enough to take a little pressure without continuously breaking. Traditional wooden pencils simply dull too quickly, requiring constant sharpening.
Diagramming with CAD
Now days, virtually all designers use CAD, or Computer Aided Design, to create construction drawings. There is no hard and fast rule that says you must create diagrams using a CAD application. Some people think that it produces a much better image and others think that it adds a level of complexity that is unnecessary. Some people swear CAD is faster, and others swear it isn’t.
The truth is there are merits to both arguments and both are correct.
CAD provides a more accurate end diagram that with the correct treatment can help render a three-dimensional image. It can be faster than hand drafting but only if the user is very proficient and has a relatively clear idea of what they want to achieve. Otherwise, the learning curve and application rigidity can make it much, much slower, especially if you are playing with your design.
There are many CAD applications on the market today, each with different advantages, limitations, functional nuances and costs. CAD applications range in cost from free (like SketchUp) to well over $4,000.
With each price increase, the applications often provide the end user more functions, add-ons and tools.
![]()
TIP: Using CAD is not required. Some people find the application learning curve and necessary attention to accuracy, more hindrance than help.
Diagram Organization
Visually communicating the project to contractors, works best when the order and labeling of diagrams is similar to common construction drawing conventions; because that is how they are already used to seeing information. The construction diagrams package consists of many sheets. Design documents for large commercial projects can easily have hundreds of pages or sheets. Even on small residential renovation projects, construction diagrams could have a dozen or more sheets depending on project complexity.
To create consistently organized diagrams that help contractors understand project details and locate specific trade work; organize project diagrams into four main sections:
- Section “A” contains architectural information.
- Section “M” contains mechanical (HVAC) information.
- Section “E” contains electrical information.
- Section “P” contains plumbing information.
Each section includes separate sheets for demolition, construction, elevations, and sections as needed.
Identify sheet numbers with the section letter followed by two sets of two digit alphanumeric numbers separated by a decimal. The pre-decimal number identifies the main sheet.
The following is a simplified list of how to name and organize the Construction Diagrams:
Sheet Number/Sheet Name
- A 1.0 Title Sheet
- A 2.0 Site Layout
- A 3.0 Demolition Floor Layout
- A 4.0 Demolition Elevations, as required
- A 5.0 Demolition Sections, as required
- A 6.0 Demolition Elevation Sections, as required
- A 7.0 Construction Floor Layout
- A 8.0 Construction Elevations, as required
- A 9.0 Construction Sections, as required
- A 10.0 Construction Elevation Sections, as required
- M 1.0 Mechanical Demolition Layout
- M 2.0 Mechanical Construction Layout
- M 3.0 Mechanical Elevations, as required
- M 4.0 Mechanical Sections, as required
- M 5.0 Mechanical Elevation Sections, as required
- E 1.0 Electrical Demolition Layout
- E 2.0 Electrical Construction Layout
- E 3.0 Electrical Elevations, as required
- E 4.0 Electrical Sections, as required
- E 5.0 Electrical Elevation Sections, as required
- P 1.0 Plumbing Demolition Layout
- P 2.0 Plumbing Construction Layout
- P 3.0 Plumbing Elevations, as required
- P 4.0 Plumbing Sections, as required
- P 5.0 Plumbing Elevation Sections, as required
On most small renovation projects you won’t need all of the sheets listed above—while larger projects may need more. Use the post-decimal numbers to identify additional sheets necessary that are associated with the main sheet. For example, if you need more demolition elevations simply identify the additional sheets with the next decimal number in the sequence, such as A4.1, A4.2, and A4.3 and so on, as needed.
What Diagrams Show
- Title Diagram provides the bidder with a complete list of diagrams included in the set.
- Site Diagram(s) illustrate information and dimensions of the Area of Construction, Site Access and Site Orientation and any Staging Area. The diagram provides an understanding of the site conditions outside of the project area, the manner of access, distance to delivery and/or parking areas.
- Demolition Diagram(s) provide bidders with an understanding of all items that require removal such as doors and windows, floors and floor coverings, walls and ceilings, wall and ceiling coverings, electrical, mechanical and plumbing fixtures.
- Construction Diagram(s) provide bidders with an understanding of what goes in the place of demolished areas and what is constructed.
- Plumbing Diagram(s) illustrate what changes, if any, are required to the plumbing system. There might be a Plumbing Demolition Diagram, if some of the pipe requires abandoning or removal.
- Mechanical Diagram(s) illustrate changes that may be necessary for the Heating, Ventilation and Air Conditioning Systems, also known as HVAC Systems.
- Electrical Diagram(s) illustrate changes that are necessary for the electrical system and any fixture that requires electricity. It illustrates the location and identifies the types of all new or relocated switches, junction boxes, fixtures and equipment.
- Elevation Diagram(s) illustrate all the same basic elements that are in the plan diagrams, but are specific to things that are happening on the vertical surfaces. Their orientation is important to the contractor’s overall understanding of the project and so it is important to reference the Site, Demolition and Construction Diagrams as applicable.
- Section Diagram(s) illustrate the same information on the Plan or Elevation Diagrams, but show enlarged views of something that is too small to visualize on the Plan or Elevation Diagram(s).
![]()
For the next step, you are going to need graph paper or multiple copies of the Construction Conductor Diagram Templates, as well as a pencil, eraser and maybe other drawing utensils or stencils.

Use the Diagram Templates and/or the Diagram Title Blocks to create and/or clearly identify each of your project diagrams.
Creating Rough Background Sketches
The first step in creating construction diagrams is creating the rough background sketches of the project area. Each sheet represents a different portion of the various aspects of the project, such as architectural, demolition, mechanical, electrical and plumbing as previously discussed in Planning – Diagram Organization and Planning – What Diagrams Show.
Your house is unique, and so is your project. That makes it almost impossible to tell you exactly what to measure in your project area. What is possible is for you to get a solid understanding of what is important so you can make the relevant notes and measurements where you need them.
Now that you have your sketching materials together, start by standing or imagining yourself standing in the middle of the space. Face north, if you know where north is. If not, pick a wall and face it. Realize that you are essentially standing in a box. It may not be a perfect cube, but it has a bottom (the floor), sides (the walls) and a top (the ceiling).
The best place to start is with the floor sketch. The floor diagram is generally the most used, and it is where we will identify the location and directional view of the remaining sketches. All project diagrams are rectangular. Using the Diagram Templates provided, orient your paper, in the direction that best fits the space. For spaces that are not (exactly) rectangular, draw your closest approximation of the area shape for that which you are about to measure.
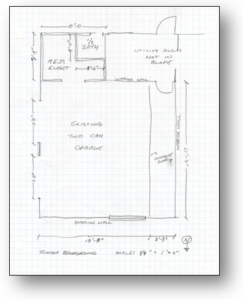
Indicate the door, window and other opening locations in relative size on the diagram using symbols such as those indicated in the left column of Figure 5. Indicate the outlets, switches and telephone connection locations on the diagram using symbols such as those indicated in the right column of Figure 5. Lastly, indicate any permanent or built in furniture or cabinets. Label it as the floor diagram and indicate the northerly direction.
When the floor sketch is complete, follow similar directions to those above as applied to the walls. Begin by sketching the shape of the north wall head-on, to create the first of the elevation diagrams. In construction drawings, “elevations” refer to drawings and diagrams of vertical surfaces. Finish by indicating the wall face on the diagram so you don’t get confused later if the walls look similar to one another. When you complete the north wall sketch, turn your body 90 degrees clockwise and follow the same directions to sketch the remaining three walls.

Figure 5. Sample Plan and Elevation Diagramming Symbols
Not every diagram will have changes to the remaining walls. If yours doesn’t, then turning clockwise from the north wall, turn until you are facing the first wall that changes. Don’t spend time drawing walls that do not change.
When done you’ll have a sketch for the floor and for each of the relevant walls and one for the floor. Don’t worry about the ceiling yet and don’t worry about making the sketches perfect. Don’t worry about scale, and don’t worry about what the drawing looks like at this point.
In some cases, the shape of a project area or space may require additional sheets.
Give each sketch a unique name and sheet number, and identify the sheet number and the directional view of all the elevation diagrams on the floor diagram. Use the rough background sketches to record measurements in Planning – Take Measurements, and as a reference for creating the background diagrams.
The last surface to sketch is the ceiling diagram. Instead of trying to sketch the ceiling as if you’re looking up at it from below, draw the ceiling from the perspective of looking down through the ceiling from above. This reduces the amount of work required to make the ceiling diagram because you use the floor diagram as the background for the ceiling diagram. Label the diagram as the Ceiling Diagram, and on it indicate the relevant measurements and locations of junction boxes, outlets, fixtures, soffits, and air conditioning grills.
Not every project will need a ceiling diagram. You will only need to draw one if you need to indicate changes to the ceiling.
Once you have all the base sketches prepared, you are ready to move to the next section to start taking measurements. Use the sketches you just prepared to record all of your measurements.
Take Measurements
Turn back to the north wall and pick a fixed point in either the left or the right corner. Make sure that you pick a point that you can repeatedly find easily. This point is your starting or origination point. Don’t try to ‘eyeball’ some arbitrary point from the middle of the room, doing so will become a problem later when you are trying to accurately calculate dimensions and quantities.
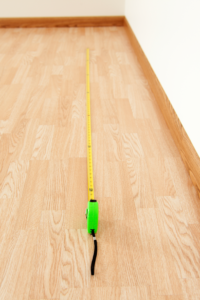
From your starting point, use a common tape measure to measure the entire physical space, length, height and width of all the existing walls, doors, windows, openings and columns. Then indicate their location, size and/or dimension on the rough background sketches. Record the measurements on the floor and elevation rough background diagrams, as needed.
Measure the length and width of the overall room; height and length of walls, corners, soffits and reveals; distance between fixed objects; width and location of doors and windows; size and location of existing built-in furnishings and fixtures such as any appliances, cabinets, recessed lamps, ceiling fans, outlets, switches, sinks, toilets, doors, windows, fireplaces, heaters and other fixed objects. Measure anything that is involved in the activities you want completed and the amount of materials needed for the project. We are not trying to create a perfect diagram, as we will be redrawing this later to scale once we have collected all the measurements. Taking this step now will help us to quickly create accurate, scalable diagrams and calculate material quantities in order to estimate costs during the creation of Planning – The Project Budget.
If you can go back to the space easily, then it makes sense to focus on the overall space. If you cannot, then make sure that you take as much time as necessary to record as much as possible about the existing furnishing, fixture and equipment locations for when you need that information later while working through creating your project diagrams.
The rough background sketches will now include:
- Overall dimensions of the space
- Location and dimension of all existing floor, wall and ceiling openings
- Location and dimension of all permanent furnishings, fixtures, and equipment
![]()
TIP: Including as much detail as possible in the background diagrams will prevent you from having to come back later to ‘check’ or ‘verify’ an item location and/or measurement.
Creating Background Diagram(s) and Diagramming Layers
At this point, you have done everything you need to do and should have just about all the information you need to make the background diagrams.
You have:
- Created rough background sketches
- Included the door, archways, and opening locations and sizes
- Included furniture fixtures and equipment
- Included notes on materials and finishes
- Taken measurements and included them on the sketches
Now, think of the plan in layers with each layer building onto the next.
The first layer is the background diagram. The background diagrams are essentially custom templates that you will use to make drafting the set of demolition and construction diagrams easier. You will use the same background to draft both the floor and reflected ceiling diagrams and one for each of the elevations.
Construction documents use industry specific symbols to identify every part of the demolition and construction of a project such as walls, doors, windows, outlets, switches, and much more. Figure 5 Sample Plan and Elevation Diagramming Symbols, gives you a tiny sample of the multitude of symbols used in construction documents.
Identify walls on the diagram with solid double-lines as indicated in Figure 5. The scale width of the space between the lines corresponds with the thickness of the wall. For example: common non-fire rated interior drywall partitions are about 5 inches thick, while most residential fire-rated partitions are 6 inches thick. Common exterior walls are generally 8 inches to 12 inches thick.
All of these common symbols make communicating among construction professionals much easier but can also make drafting by hand a tedious process. Some companies make simple drafting stencils you can purchase to make drafting easier. Stencils exist to help you draw elements such as walls, windows, doors, electrical, mechanical, plumbing, furniture, fixtures, and accessories easier to draw.
Review the suggested Diagramming Tools you can use to help you easily create your project diagrams.
With the background diagram complete, make enough photocopies to make all of the diagrams needed for your project, according to Planning – Diagram Organization. Then set the original background diagram aside in case you need them later. You may find you need additional diagrams or need to replace previously drawn diagrams with new ones. Setting the original background diagrams aside will keep them clean and available to make additional copies if you need, so that you do not have to redraw them from scratch.
Drawing on top of the copies of the background diagram will create all of the subsequent diagrams. With enough copies to create all of your drawings, start creating the title, site, demolition, floor, wall, ceiling, plumbing, mechanical, electrical, elevation, and section diagram(s) as needed, for your project.
![]()
TIP: If this is the first time you are working through this step in your project, you should skip over to Planning – Assemble the Project Budget and come back here after completing that step.
Create Presentation Diagrams
To ensure the project diagrams are easily reproducible, printable anywhere, and accurately measurable, use 8 1/2 x 11-inch scalable graph paper. Not all graph paper is scalable, so make sure you select one that has squares that fit into one inch equally. Use blank copies of the 8½-inch x 11-inch Construction Conductor Diagram Templates to easily create your project diagrams.
For each rough background sketch that you created, figure out the overall length and width of the project area on that sheet in order to determine the scale you will want to draft the final background sketches. If you need to add up several linear dimensions in order to determine the overall area dimensions, make sure there are no gaps or overlaps between dimensions.
For a small project consisting of one room or two adjacent rooms, you should easily get the entire project area to fit on one 8½-inch x 11-inch sheet. If you are working on an entire house, with multiple floors, you will have to break up the drawing into multiple manageable sections. Make sure to use the same scale to diagram all sections.
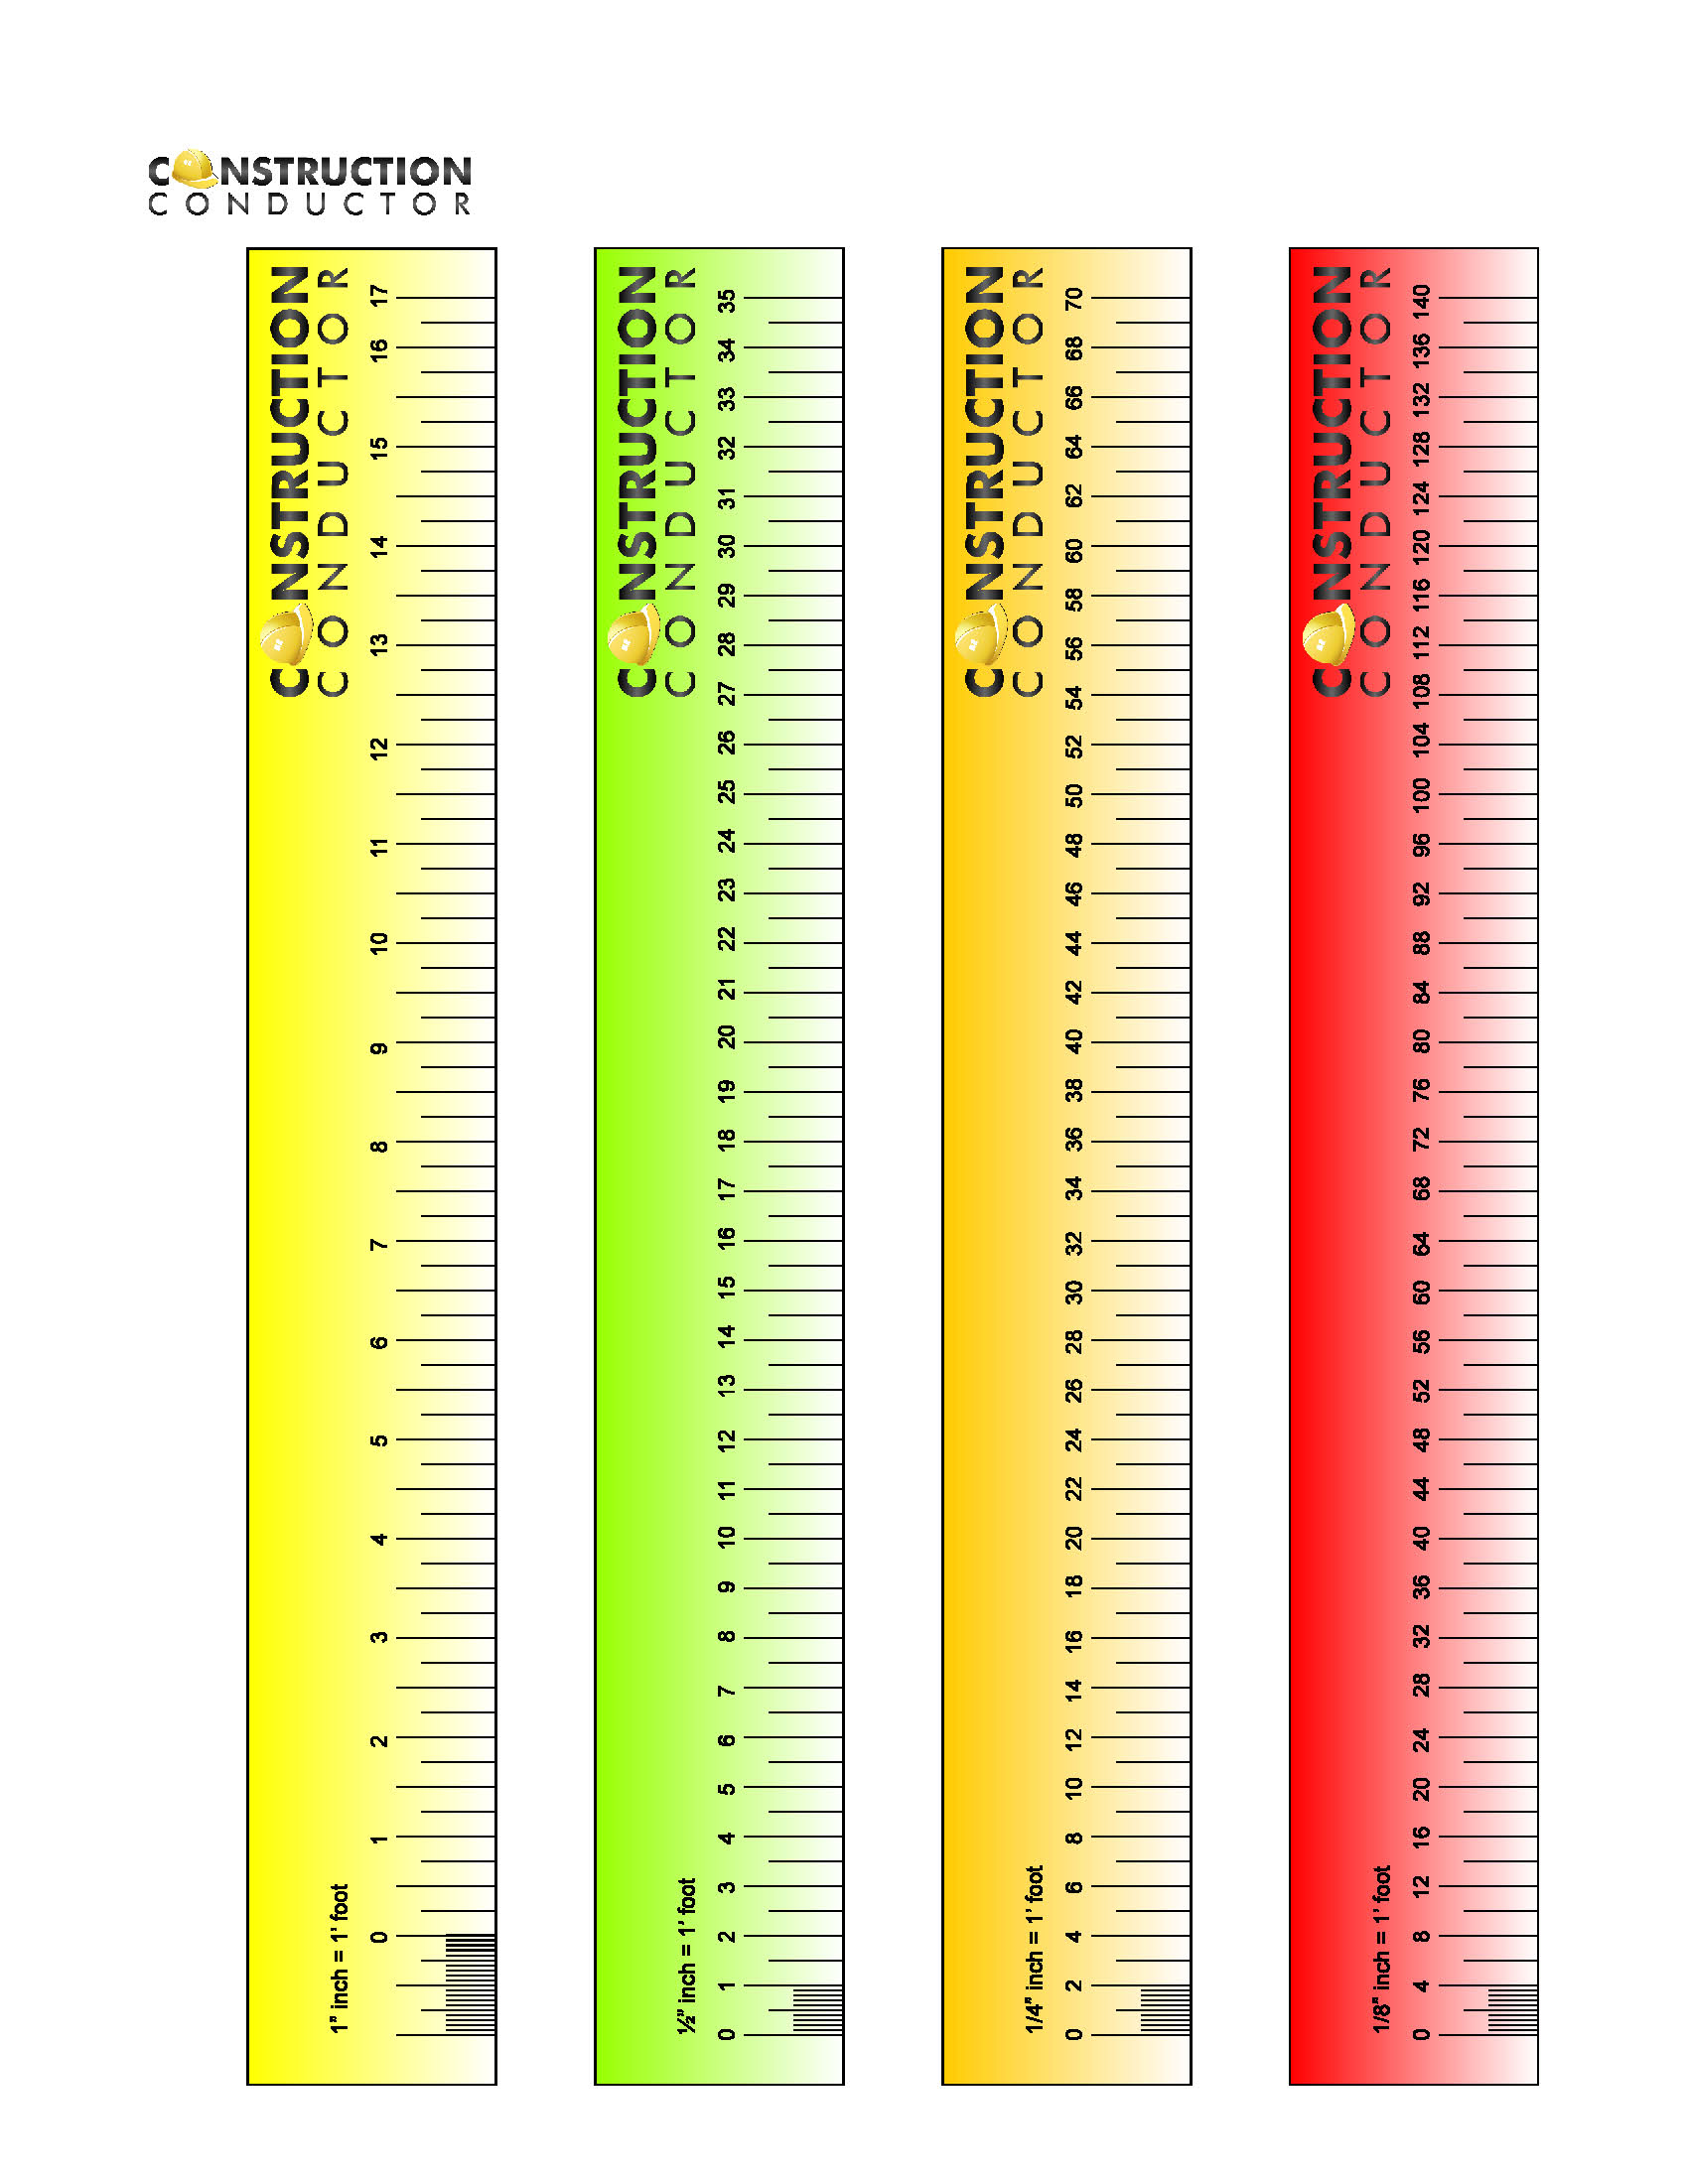
Drawing to scale is about understanding how to convert linear foot measurements to fractions of an inch. The easiest way to diagram in scaled measurements is to use architectural and engineering scales. These scales represent defined measurements at reduced sizes. Various companies make scales in different shapes, sizes, lengths, and dimensions.
Use architectural scales to illustrate structural and interior details. Most architectural scales have measurements reading in fractions of an inch such as, 1/2, 1/4, 1/8th, 1/16th and smaller.
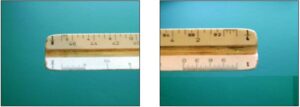
Use engineering scales to illustrate much larger areas such as landscaping or overall site plans. Companies generally make them to measure in multiples of 10 feet using fractions of an inch such as, 1:10, 1:20, 1:30, 1:40, 1:50, 1:100, 1:200, 1:400, 1:500 and more. Using a scale makes drawing to scale easier, because it works just like a conventional ruler but with the lines representing greater linear distances.
For detailed information about how to read and use architectural and engineering scales, FEMA has a good pamphlet that describes how to use scales and provides practice exercises to help you develop the skill.
Use this basic set of printable Architectural Scales, to help you correctly measure and your diagrams.
Wrapping up the Diagrams
You’ll know you’re done diagramming when you have described the project and identified all the scope work you want complete. When you think you’re done with the diagrams, use the Project Diagrams Checklist checklist to make sure that you have everything included.